Dekorationsartikel gehören nicht zum Leistungsumfang.
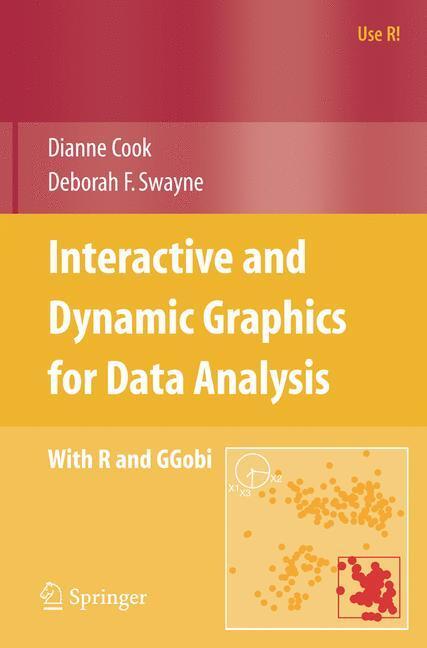
Interactive and Dynamic Graphics for Data Analysis
With R and GGobi
Taschenbuch von Dianne Cook (u. a.)
Sprache: Englisch

55,20 €*

inkl. MwSt.

Versandkostenfrei per Post / DHL

Lieferzeit 1-2 Wochen

Kategorien:
Beschreibung
This book is about using interactive and dynamic plots on a computer screen as part of data exploration and modeling, both alone and as a partner with static graphics and non-graphical computational methods. The area of int- active and dynamic data visualization emerged within statistics as part of research on exploratory data analysis in the late 1960s, and it remains an active subject of research today, as its use in practice continues to grow. It now makes substantial contributions within computer science as well, as part of the growing ?elds of information visualization and data mining, especially visual data mining. The material in this book includes: ¿ An introduction to data visualization, explaining how it di?ers from other types of visualization. ¿ Adescriptionofourtoolboxofinteractiveanddynamicgraphicalmethods. ¿ An approach for exploring missing values in data. ¿ An explanation of the use of these tools in cluster analysis and supervised classi?cation. ¿ An overview of additional material available on the web. ¿ A description of the data used in the analyses and exercises. The book¿s examples use the software R and GGobi. R (Ihaka & Gent- man 1996, RDevelopment CoreTeam2006) isafreesoftware environment for statistical computing and graphics; it is most often used from the command line, provides a wide variety of statistical methods, and includes high¿quality staticgraphics.RaroseintheStatisticsDepartmentoftheUniversityofAu- land and is now developed and maintained by a global collaborative e?ort.
Zusammenfassung

This richly illustrated book describes the use of interactive and dynamic graphics as part of multidimensional data analysis. Chapters include clustering, supervised classification, and working with missing values. A variety of plots and interaction methods are used in each analysis, often starting with brushing linked low-dimensional views and working up to manual manipulation of tours of several variables. The role of graphical methods is shown at each step of the analysis, not only in the early exploratory phase, but in the later stages, too, when comparing and evaluating models. All examples are based on freely available software: Ggobi for interactive graphics and R for static graphics, modeling, and programming. The book may be used as a text in a class on statistical graphics or exploratory data analysis, for example, or as a guide for the independent learner. Each chapter ends with a set of exercises.

Inhaltsverzeichnis
TheToolbox.- Missing Values.- Supervised Classification.- Cluster Analysis.- Miscellaneous Topics.- Datasets.
Details
Erscheinungsjahr: 2007
Fachbereich: Wahrscheinlichkeitstheorie
Genre: Mathematik
Rubrik: Naturwissenschaften & Technik
Medium: Taschenbuch
Seiten: 208
Reihe: Use R!
Inhalt: xviii
188 S.
ISBN-13: 9780387717616
ISBN-10: 0387717617
Sprache: Englisch
Herstellernummer: 11967125
Ausstattung / Beilage: Paperback
Einband: Kartoniert / Broschiert
Autor: Cook, Dianne
Swayne, Deborah F.
Auflage: 2007
Hersteller: Springer New York
Springer US, New York, N.Y.
Use R!
Maße: 235 x 155 x 14 mm
Von/Mit: Dianne Cook (u. a.)
Erscheinungsdatum: 12.12.2007
Gewicht: 0,362 kg
preigu-id: 102043703
Warnhinweis

Ähnliche Produkte

Ähnliche Produkte