120,50 €*
Versandkostenfrei per Post / DHL
Aktuell nicht verfügbar
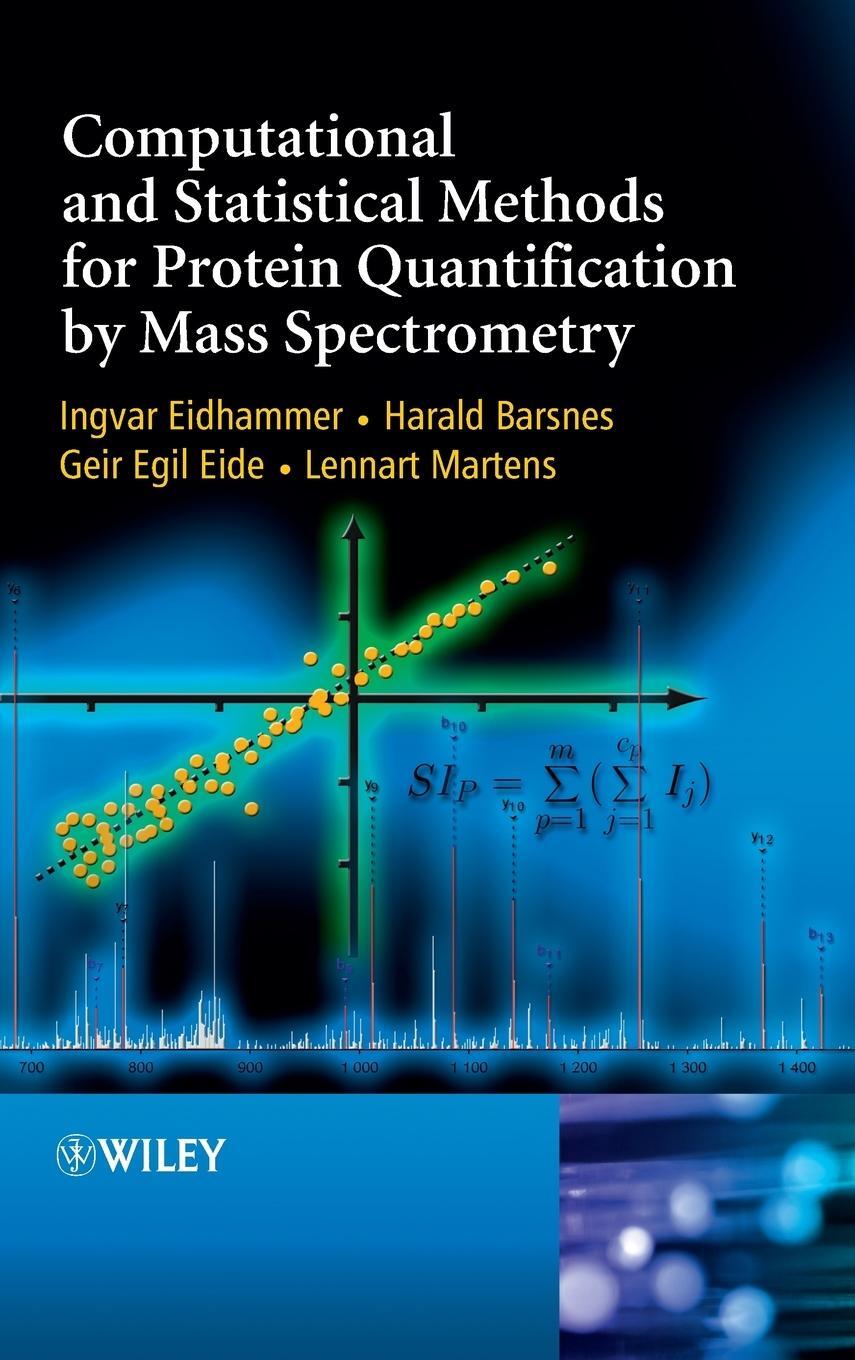
This book provides all the necessary knowledge about mass spectrometry based proteomics methods and computational and statistical approaches to pursue the planning, design and analysis of quantitative proteomics experiments. The author's carefully constructed approach allows readers to easily make the transition into the field of quantitative proteomics. Through detailed descriptions of wet-lab methods, computational approaches and statistical tools, this book covers the full scope of a quantitative experiment, allowing readers to acquire new knowledge as well as acting as a useful reference work for more advanced readers.
Computational and Statistical Methods for Protein Quantification by Mass Spectrometry:
* Introduces the use of mass spectrometry in protein quantification and how the bioinformatics challenges in this field can be solved using statistical methods and various software programs.
* Is illustrated by a large number of figures and examples as well as numerous exercises.
* Provides both clear and rigorous descriptions of methods and approaches.
* Is thoroughly indexed and cross-referenced, combining the strengths of a text book with the utility of a reference work.
* Features detailed discussions of both wet-lab approaches and statistical and computational methods.
With clear and thorough descriptions of the various methods and approaches, this book is accessible to biologists, informaticians, and statisticians alike and is aimed at readers across the academic spectrum, from advanced undergraduate students to post doctorates entering the field.
Ingvar Eidhammer, Department of Informatics, University of Bergen, Norway
Harald Barsnes, Department of Biomedicine, University of Bergen, Norway
Geir Egil Eide, Centre for Clinical Research, Haukeland University, Norway
Lennart Martens, Department of Biochemistry, Faculty of Medicine and Health Sciences, Ghent University, Belgium
Terminology xvii
Acknowledgements xix
1 Introduction 1
1.1 The composition of an organism 1
1.2 Homeostasis, physiology, and pathology 4
1.3 Protein synthesis 4
1.4 Site, sample, state, and environment 4
1.5 Abundance and expression - protein and proteome profiles 5
1.6 The importance of exact specification of sites and states 6
1.7 Relative and absolute quantification 8
1.8 In vivo and in vitro experiments 9
1.9 Goals for quantitative protein experiments 10
1.10 Exercises 10
2 Correlations of mRNA and protein abundances 12
2.1 Investigating the correlation 12
2.2 Codon bias 14
2.3 Main results from experiments 15
2.4 The ideal case for mRNA-protein comparison 16
2.5 Exploring correlation across genes 17
2.6 Exploring correlation within one gene 18
2.7 Correlation across subsets 18
2.8 Comparing mRNA and protein abundances across genes from two situations 19
2.9 Exercises 20
2.10 Bibliographic notes 21
3 Protein level quantification 22
3.1 Two-dimensional gels 22
3.2 Protein arrays 23
3.3 Western blotting 25
3.4 ELISA - Enzyme-Linked Immunosorbent Assay 26
3.5 Bibliographic notes 26
4 Mass spectrometry and protein identification 27
4.1 Mass spectrometry 27
4.2 Isotope composition of peptides 32
4.3 Presenting the intensities - the spectra 36
4.4 Peak intensity calculation 38
4.5 Peptide identification by MS/MS spectra 38
4.6 The protein inference problem 42
4.7 False discovery rate for the identifications 44
4.8 Exercises 46
4.9 Bibliographic notes 47
5 Protein quantification by mass spectrometry 48
5.1 Situations, protein, and peptide variants 48
5.2 Replicates 49
5.3 Run - experiment - project 50
5.4 Comparing quantification approaches/methods 54
5.5 Classification of approaches for quantification using LC-MS/MS 57
5.6 The peptide (occurrence) space 60
5.7 Ion chromatograms 62
5.8 From peptides to protein abundances 62
5.9 Protein inference and protein abundance calculation 67
5.10 Peptide tables 70
5.11 Assumptions for relative quantification 70
5.12 Analysis for differentially abundant proteins 71
5.13 Normalization of data 71
5.14 Exercises 72
5.15 Bibliographic notes 74
6 Statistical normalization 75
6.1 Some illustrative examples 75
6.2 Non-normally distributed populations 76
6.3 Testing for normality 78
6.4 Outliers 82
6.5 Variance inequality 90
6.6 Normalization and logarithmic transformation 90
6.7 Exercises 94
6.8 Bibliographic notes 95
7 Experimental normalization 96
7.1 Sources of variation and level of normalization 96
7.2 Spectral normalization 98
7.3 Normalization at the peptide and protein level 103
7.4 Normalizing using sum, mean, and median 104
7.5 MA-plot for normalization 104
7.6 Local regression normalization - LOWESS 106
7.7 Quantile normalization 107
7.8 Overfitting 108
7.9 Exercises 109
7.10 Bibliographic notes 109
8 Statistical analysis 110
8.1 Use of replicates for statistical analysis 110
8.2 Using a set of proteins for statistical analysis 111
8.3 Missing values 116
8.4 Prediction and hypothesis testing 118
8.5 Statistical significance for multiple testing 121
8.6 Exercises 127
8.7 Bibliographic notes 128
9 Label based quantification 129
9.1 Labeling techniques for label based quantification 129
9.2 Label requirements 130
9.3 Labels and labeling properties 130
9.4 Experimental requirements 132
9.5 Recognizing corresponding peptide variants 133
9.6 Reference free vs. reference based 135
9.7 Labeling considerations 136
9.8 Exercises 136
9.9 Bibliographic notes 137
10 Reporter based MS/MS quantification 138
10.1 Isobaric labels 138
10.2 iTRAQ 140
10.3 TMT - Tandem Mass Tag 145
10.4 Reporter based quantification runs 145
10.5 Identification and quantification 145
10.6 Peptide table 147
10.7 Reporter based quantification experiments 147
10.8 Exercises 152
10.9 Bibliographic notes 153
11 Fragment based MS/MS quantification 155
11.1 The label masses 155
11.2 Identification 157
11.3 Peptide and protein quantification 158
11.4 Exercises 158
11.5 Bibliographic notes 159
12 Label based quantification by MS spectra 160
12.1 Different labeling techniques 160
12.2 Experimental setup 166
12.3 MaxQuant as a model 167
12.4 The MaxQuant procedure 169
12.5 Exercises 183
12.6 Bibliographic notes 184
13 Label free quantification by MS spectra 185
13.1 An ideal case - two protein samples 185
13.2 The real world 186
13.3 Experimental setup 187
13.4 Forms 187
13.5 The quantification process 188
13.6 Form detection 189
13.7 Pair-wise retention time correction 191
13.8 Approaches for form tuple detection 193
13.9 Pair-wise alignment 193
13.10 Using a reference run for alignment 196
13.11 Complete pair-wise alignment 197
13.12 Hierarchical progressive alignment 197
13.13 Simultaneous iterative alignment 200
13.14 The end result and further analysis 202
13.15 Exercises 202
13.16 Bibliographic notes 204
14 Label free quantification by MS/MS spectra 205
14.1 Abundance measurements 205
14.2 Normalization 207
14.3 Proposed methods 207
14.4 Methods for single abundance calculation 207
14.5 Methods for relative abundance calculation 210
14.6 Comparing methods 212
14.7 Improving the reliability of spectral count quantification 213
14.8 Handling shared peptides 214
14.9 Statistical analysis 215
14.10 Exercises 215
14.11 Bibliographic notes 216
15 Targeted quantification - Selected Reaction Monitoring 218
15.1 Selected Reaction Monitoring - the concept 218
15.2 A suitable instrument 219
15.3 The LC-MS/MS run 220
15.4 Label free and label based quantification 224
15.5 Requirements for SRM transitions 227
15.6 Finding optimal transitions 229
15.7 Validating transitions 230
15.8 Assay development 232
15.9 Exercises 233
15.10 Bibliographic notes 234
16 Absolute quantification 235
16.1 Performing absolute quantification 235
16.2 Label based absolute quantification 236
16.3 Label free absolute quantification 239
16.4 Exercises 242
16.5 Bibliographic notes 242
17 Quantification of post-translational modifications 244
17.1 PTM and mass spectrometry 244
17.2 Modification degree 245
17.3 Absolute modification degree 246
17.4 Relative modification degree 250
17.5 Discovery based modification stoichiometry 251
17.6 Exercises 253
17.7 Bibliographic notes 253
18 Biomarkers 254
18.1 Evaluation of potential biomarkers 254
18.2 Evaluating threshold values for biomarkers 257
18.3 Exercises 258
18.4 Bibliographic notes 258
19 Standards and databases 259
19.1 Standard data formats for (quantitative) proteomics 259
19.2 Databases for proteomics data 262
19.3 Bibliographic notes 263
20 Appendix A: Statistics 264
20.1 Samples, populations, and statistics 264
20.2 Population parameter estimation 265
20.3 Hypothesis testing 267
20.4 Performing the test - test statistics and p-values 268
20.5 Comparing means of populations 271
20.6 Comparing variances 276
20.7 Percentiles and quantiles 278
20.8 Correlation 280
20.9 Regression analysis 287
20.10 Types of values and variables 290
21 Appendix B: Clustering and discriminant analysis 292
21.1 Clustering 292
21.2 Discriminant analysis 303
21.3 Bibliographic notes 312
Bibliography 313
Index 327
| Erscheinungsjahr: | 2013 |
|---|---|
| Fachbereich: | Wahrscheinlichkeitstheorie |
| Genre: | Mathematik |
| Rubrik: | Naturwissenschaften & Technik |
| Medium: | Buch |
| Seiten: | 360 |
| Inhalt: | 354 S. |
| ISBN-13: | 9781119964001 |
| ISBN-10: | 1119964008 |
| Sprache: | Englisch |
| Einband: | Gebunden |
| Autor: |
Eidhammer, Ingvar
Barsnes, Harald Eide, Geir Egil Martens, Lennart |
| Hersteller: |
Wiley
John Wiley & Sons |
| Maße: | 235 x 157 x 24 mm |
| Von/Mit: | Ingvar Eidhammer (u. a.) |
| Erscheinungsdatum: | 11.02.2013 |
| Gewicht: | 0,668 kg |

